


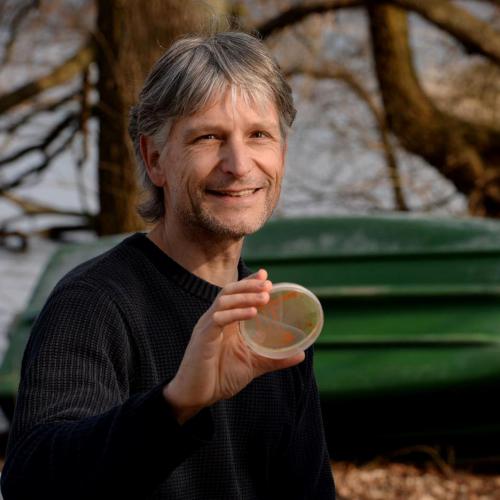
Construction of a clickable probe-based protein chip platform for discovering covalent mIDH1 inhibitors from natural medicinal extracts
- 12 February 2026
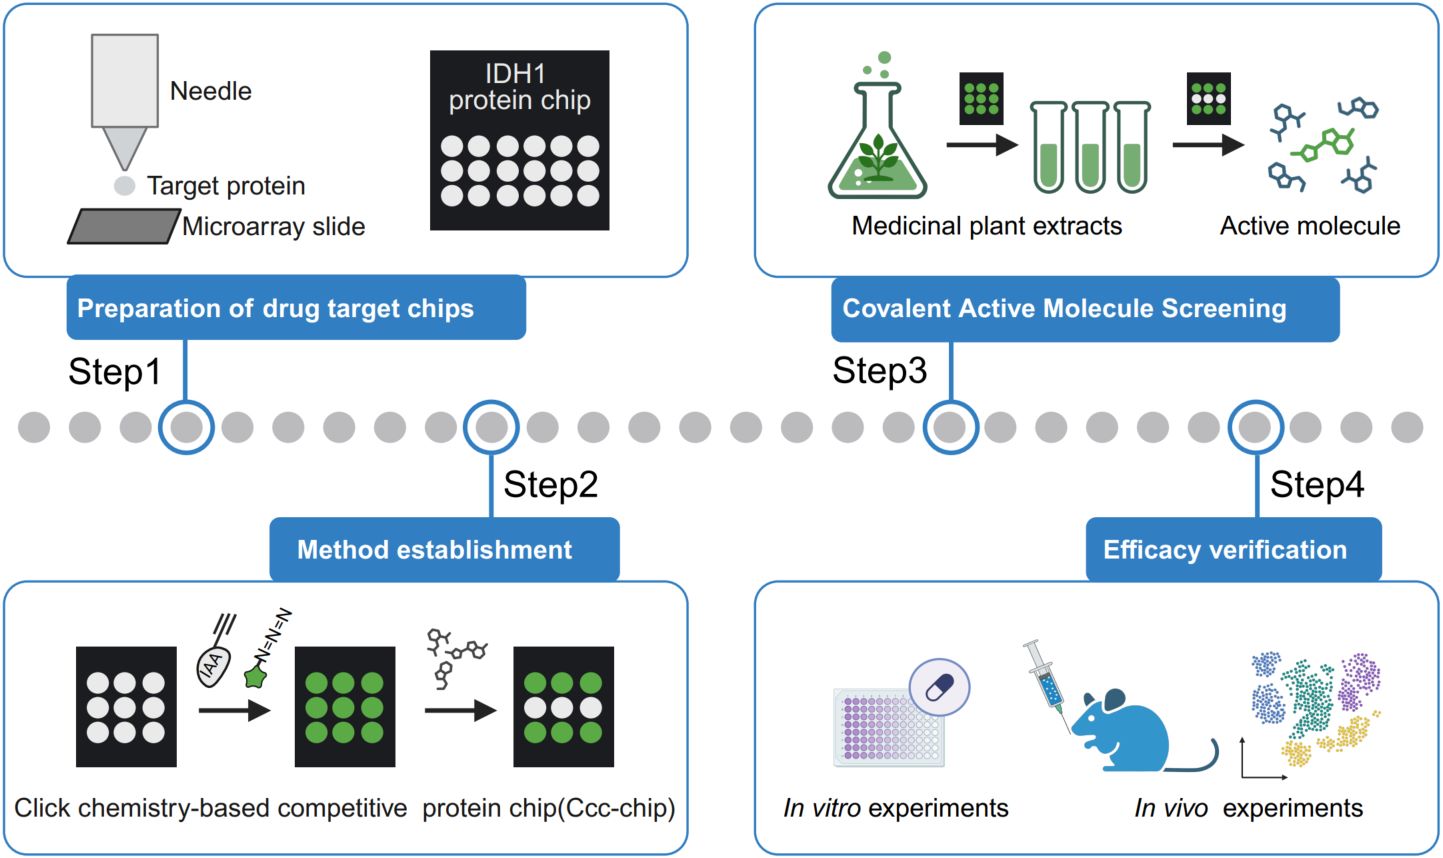
In this study, we develop a flexible Ccc-Chip (protein microarray + bioorthogonal click chemistry) for high-throughput screening of natural covalent active molecules from medicinal plant extracts, identifying flavokawain C from Piper methysticum Forst as a novel covalent mIDH1 inhibitor.
Climate factors drive the local adaptation of Old World cattle
- 09 February 2026
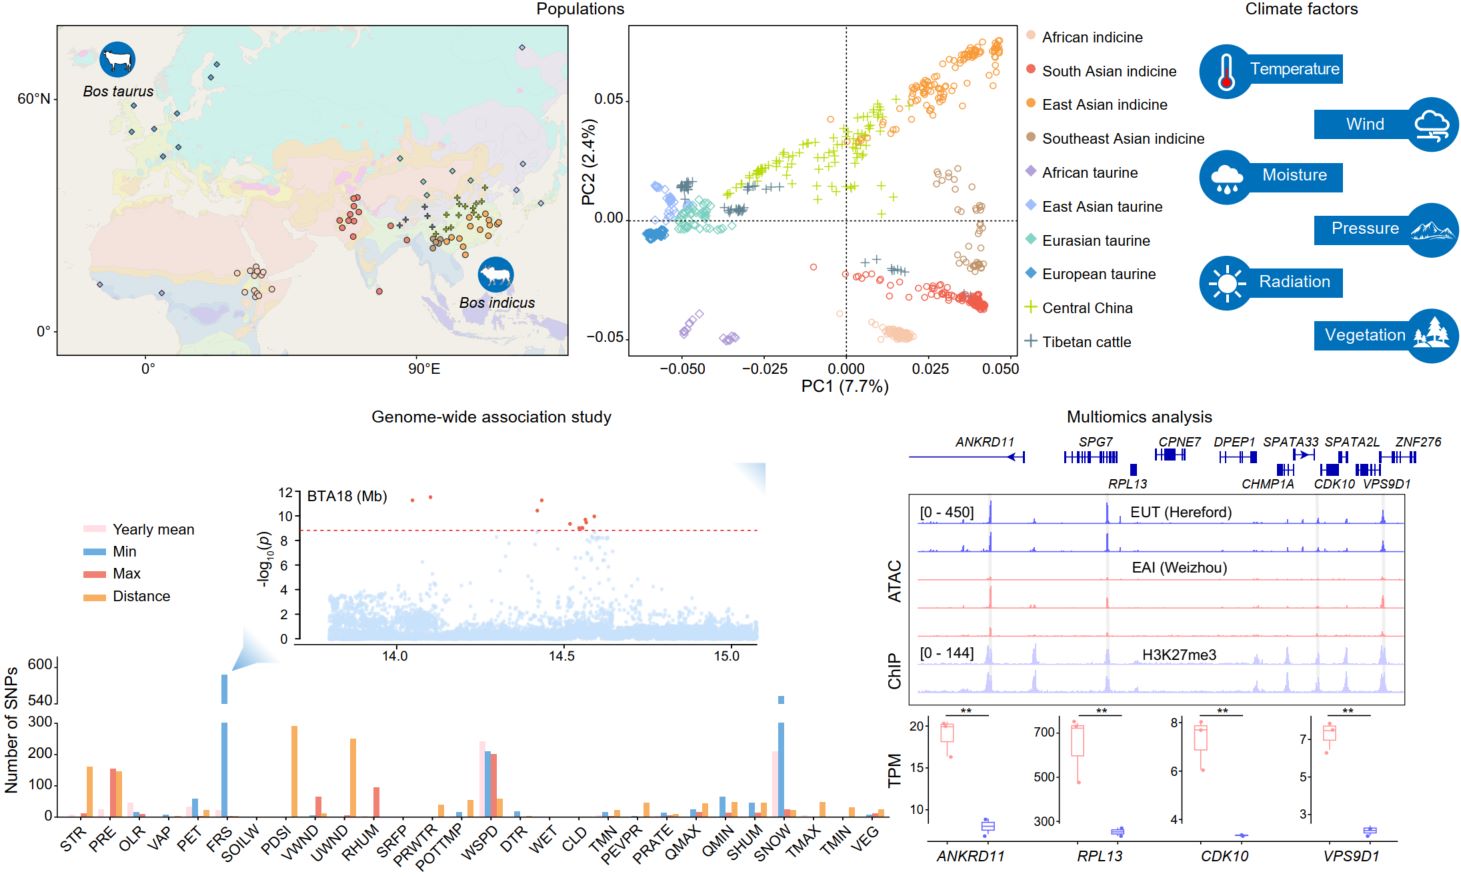
Climate adaptation genomics of cattle. We comparatively analyzed genomic data from 85 Old World cattle breeds/populations of Eurasia and Africa to identify genetic factors associated with climate factors. Environmental genome-wide association studies revealed 3165 single-nucleotide polymorphisms (SNPs) with strong correlations between climate factors and allele frequencies. We also identified loci that were significantly associated with temperature factors in the regulatory regions, such as promoter regions, of genes (ANKRD11, RPL13, CDK10, and VPS9D1) under strong selection pressure on Bos taurus autosome 18, which might regulate the expression of these genes. These significantly associated SNPs could be used as potential resources for marker-assisted breeding programs aimed at climate resilience and sustainable cattle production under changing environmental conditions.
BIOME cohort: Multi-system microbiome dynamics and clinical outcomes in massive burn injury patients
- 29 January 2026
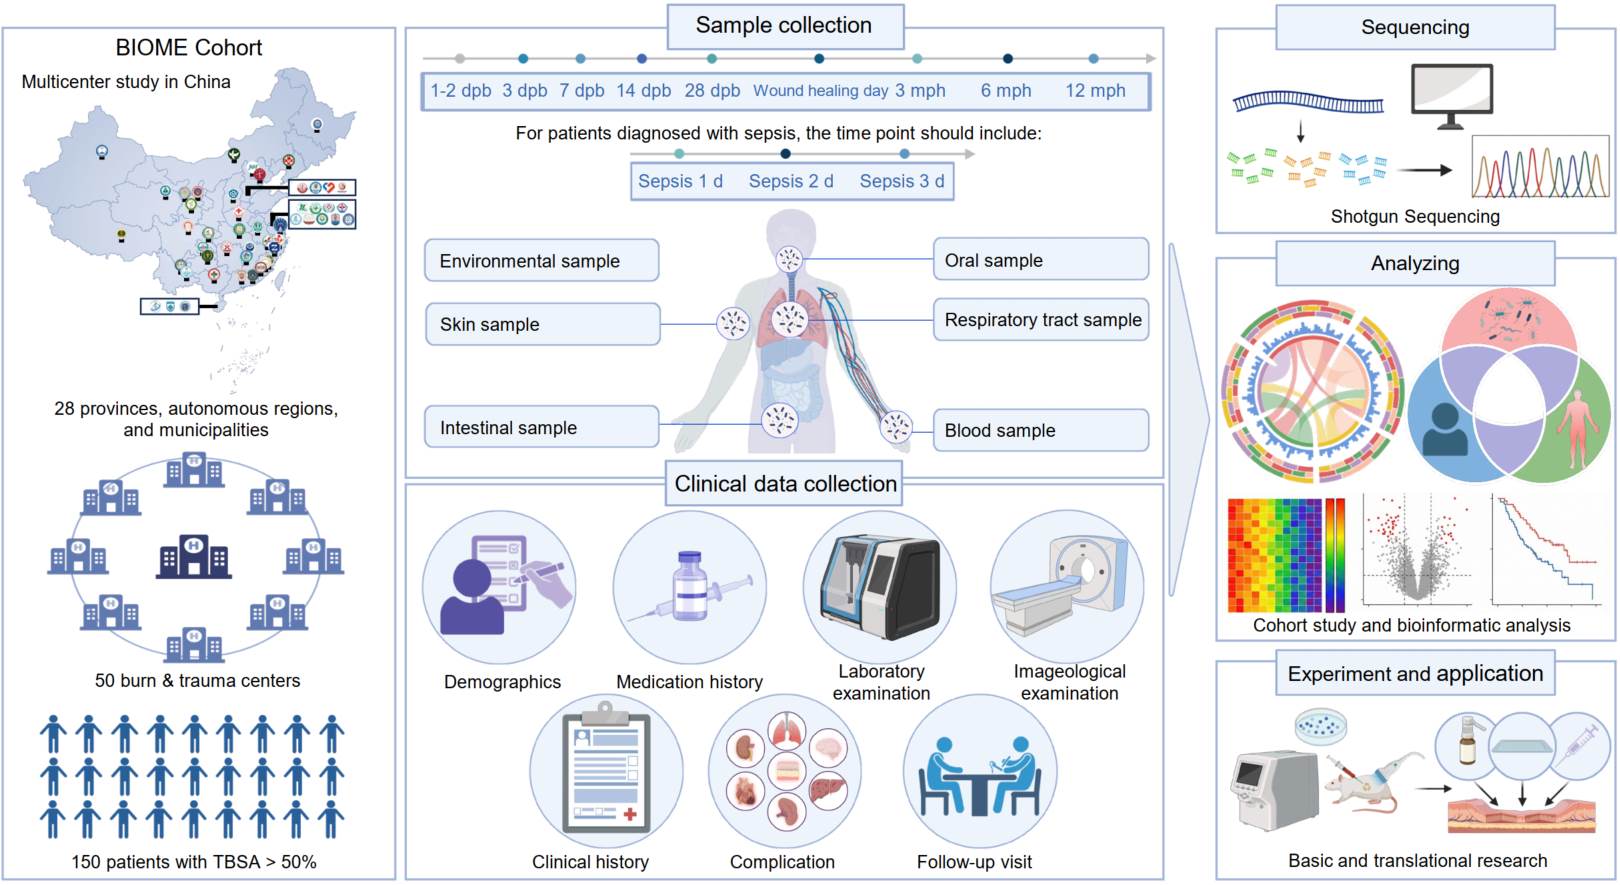
Massive burn injuries (MBIs) are associated with high mortality and disability rates, primarily due to microbial-driven sepsis from extensive skin barrier loss and subsequent scar formation. This makes MBI a compelling model for studying multi-system microbial dysbiosis following skin barrier destruction. We launched the Burn & Trauma Injury Organisms and Microbiome Ecology (BIOME) project, planning to enroll at least 150 MBI patients from 50 hospitals across 28 provinces, autonomous regions, and municipalities in China. The cohort includes skin swabs, intestinal and oral samples, and longitudinal clinical data collected from within 72 h post-injury through 1 year of follow-up. This multicenter, prospective, longitudinal cohort will establish a comprehensive clinical microbiota resource for patients with MBI. By integrating multi-system microbiome profiling with clinical outcomes, the BIOME project aims to elucidate the translational role of microbiota reconstruction as a potential target for diagnosis, prognosis, and therapeutic intervention in severe burn care.
The role of the gut microbiome in the regulation of high-altitude adaptation
- 19 January 2026
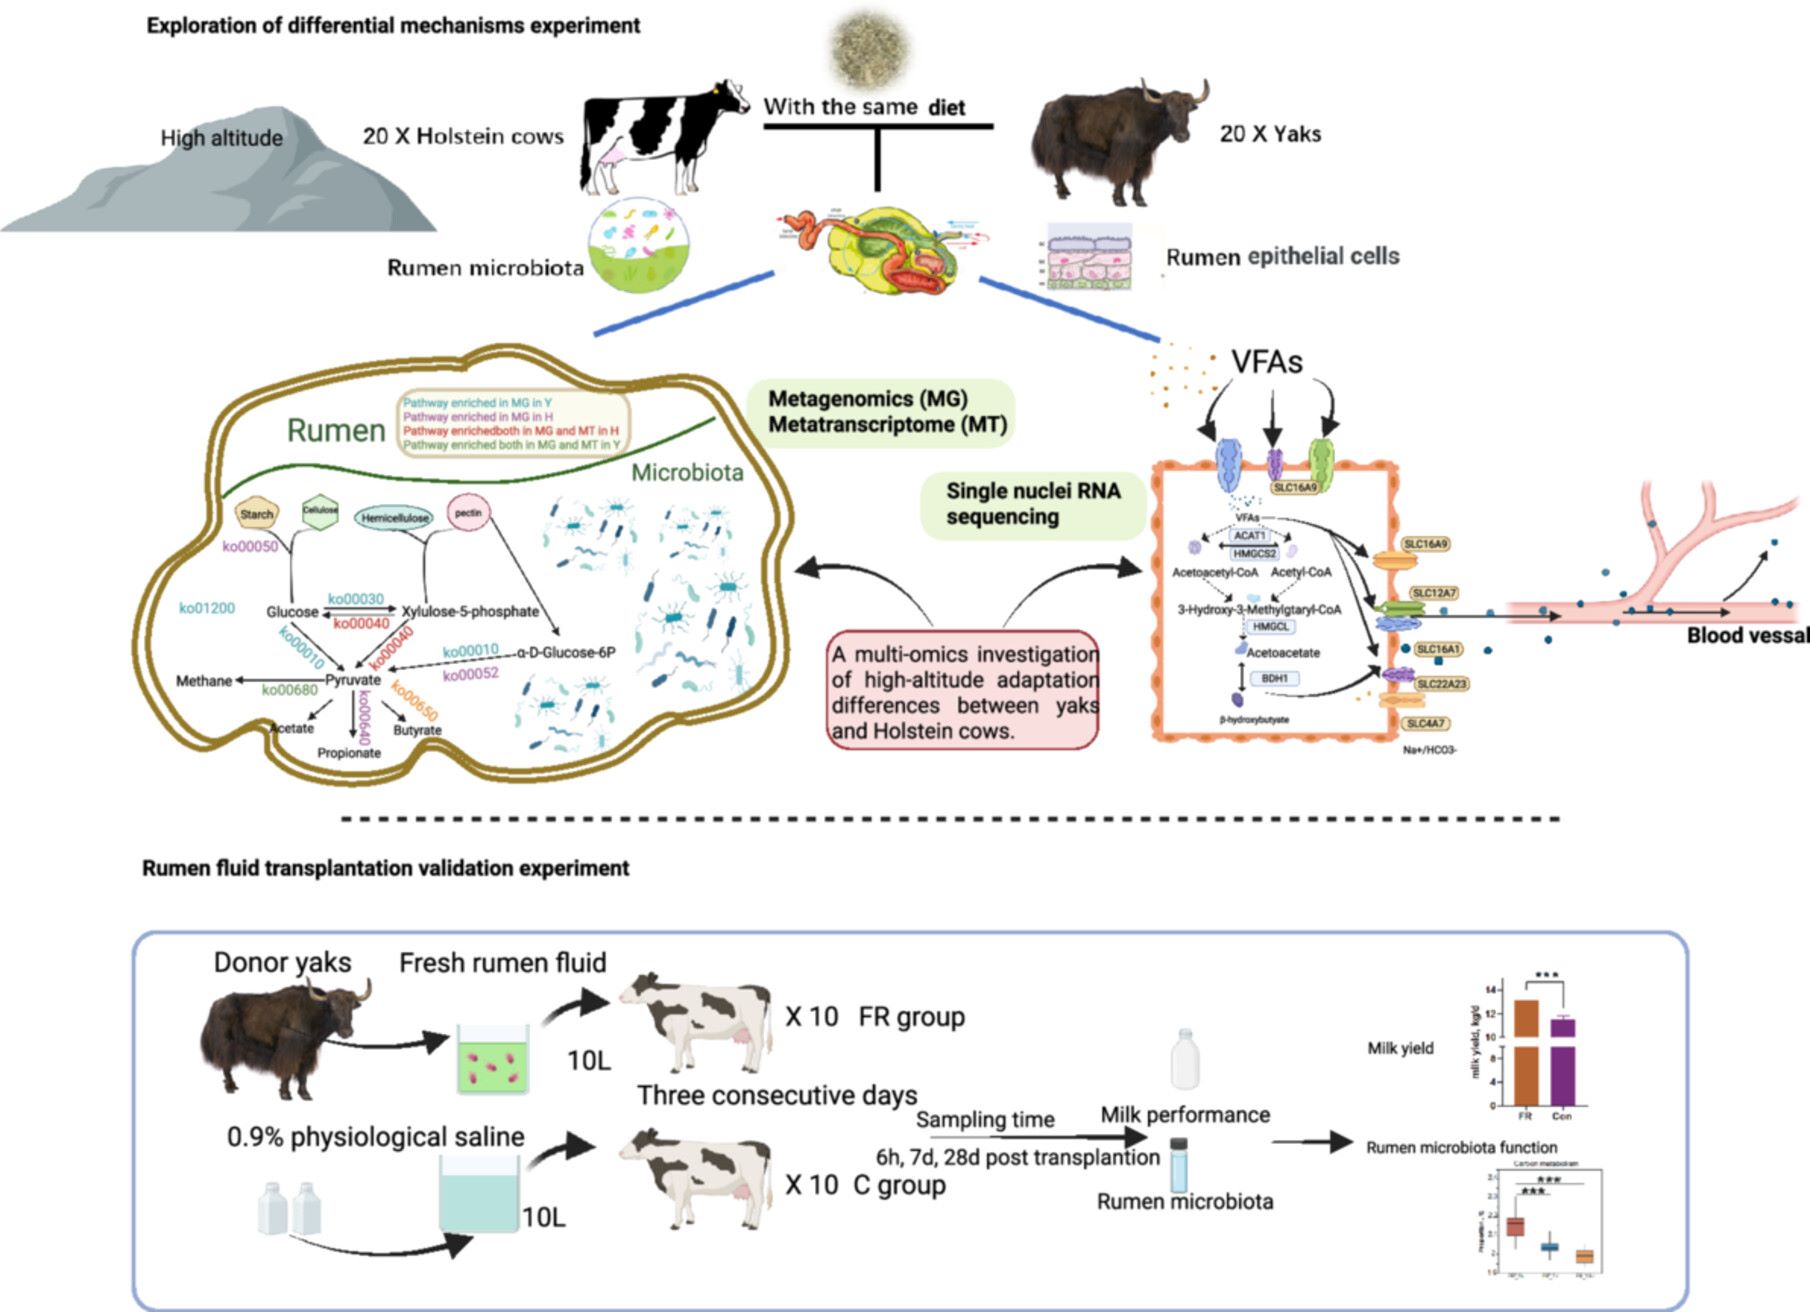
This study is the first to elucidate mechanisms of high-altitude adaptation from the perspective of the rumen ecosystem by using indigenous yaks and Holstein cows that have lived at high altitude since birth as comparative models. Through a systematic comparison of their rumen ecology using multi-omics approaches—including rumen metagenomics, metatranscriptomics, and single-nucleus transcriptomics—we identified distinct adaptive strategies employed by the two species under extreme plateau environments. Specifically, the rumen microbiota of yaks was enriched in central carbon metabolism pathways, whereas the microbiota of Holstein cows was enriched in pathways related to the degradation of specific complex carbohydrates. Concurrently, yak rumen epithelial cells exhibited increased expression of genes associated with ketone body metabolism, along with higher pathway activity scores for ketone body biosynthesis and fatty acid beta-oxidation. Moreover, we introduced rumen fluid transplantation from yaks for the first time and observed that, under the conditions of this study, yak microbiota transplantation increased milk yield in Holstein cows. After transplantation, the carbon metabolism of the rumen microbiota gradually declined, further confirming the key role of the rumen microbiota in regulating host energy supply in the context of yak high-altitude adaptation. Overall, this study deciphers the mechanisms by which gastrointestinal microbiota contributes to high-altitude adaptation in ruminants and provides a new perspective for addressing challenges related to adaptation to high-altitude environments.
Host-driven hepatic conversion of gut microbiota-derived putrescine to spermidine mediates mannose's protective effects against hepatic steatosis in zebrafish
- 20 December 2025
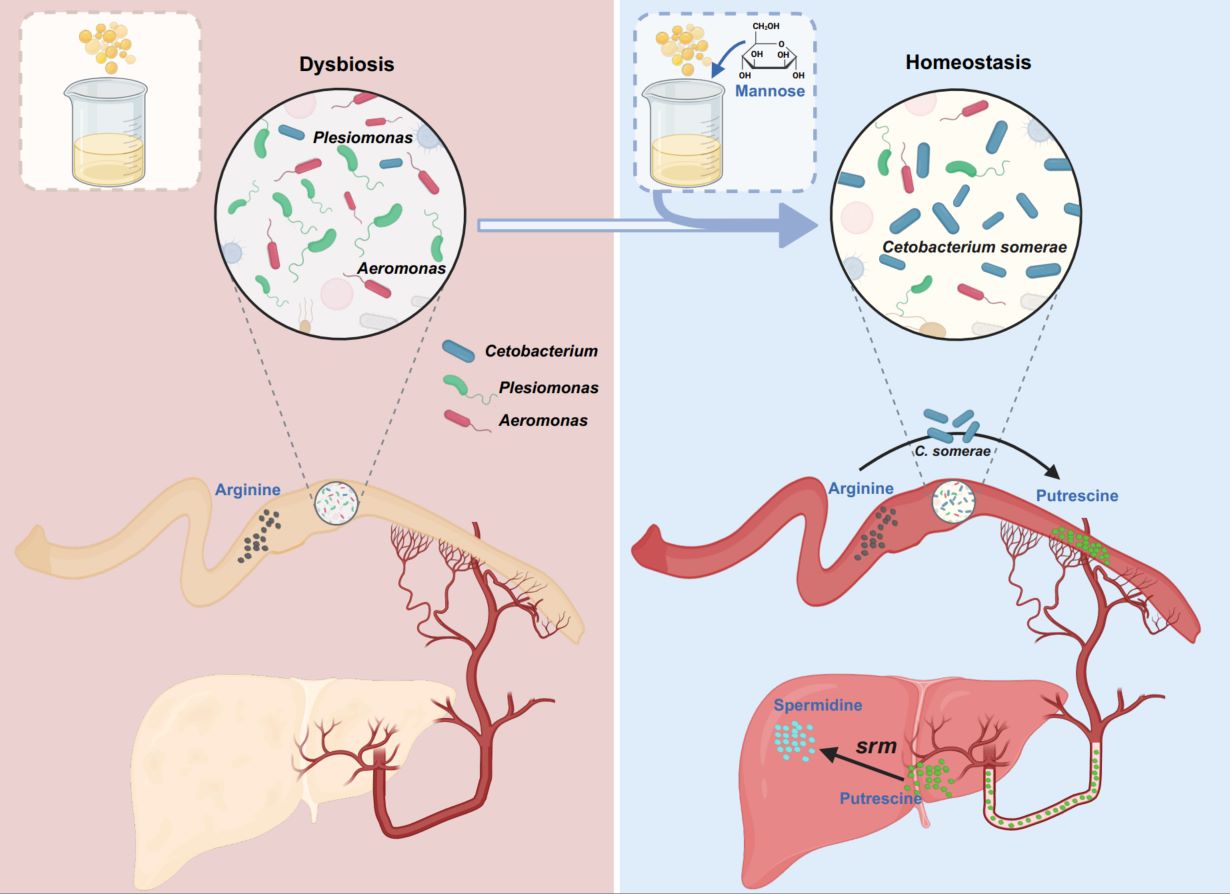
Evidence for liver metabolism of gut-derived microbial compounds into beneficial secondary metabolites has been lacking. Here, we demonstrate that Cetobacterium somerae (C. somerae), enriched by mannose supplementation under high-fat diet conditions, convert arginine into putrescine. The liver subsequently converts this microbial-derived putrescine to spermidine, which functions as an effector molecule to reduce hepatic lipid accumulation. These findings uncover a novel host-microbiota collaborative mechanism in which the arginine-putrescine-spermidine metabolic pathway is completed through inter-kingdom cooperation to ameliorate hepatic steatosis.
Nano-plastics disrupt systemic metabolism by remodeling the bile acid–microbiota axis and driving hepatic–intestinal dysfunction
- 31 December 2025
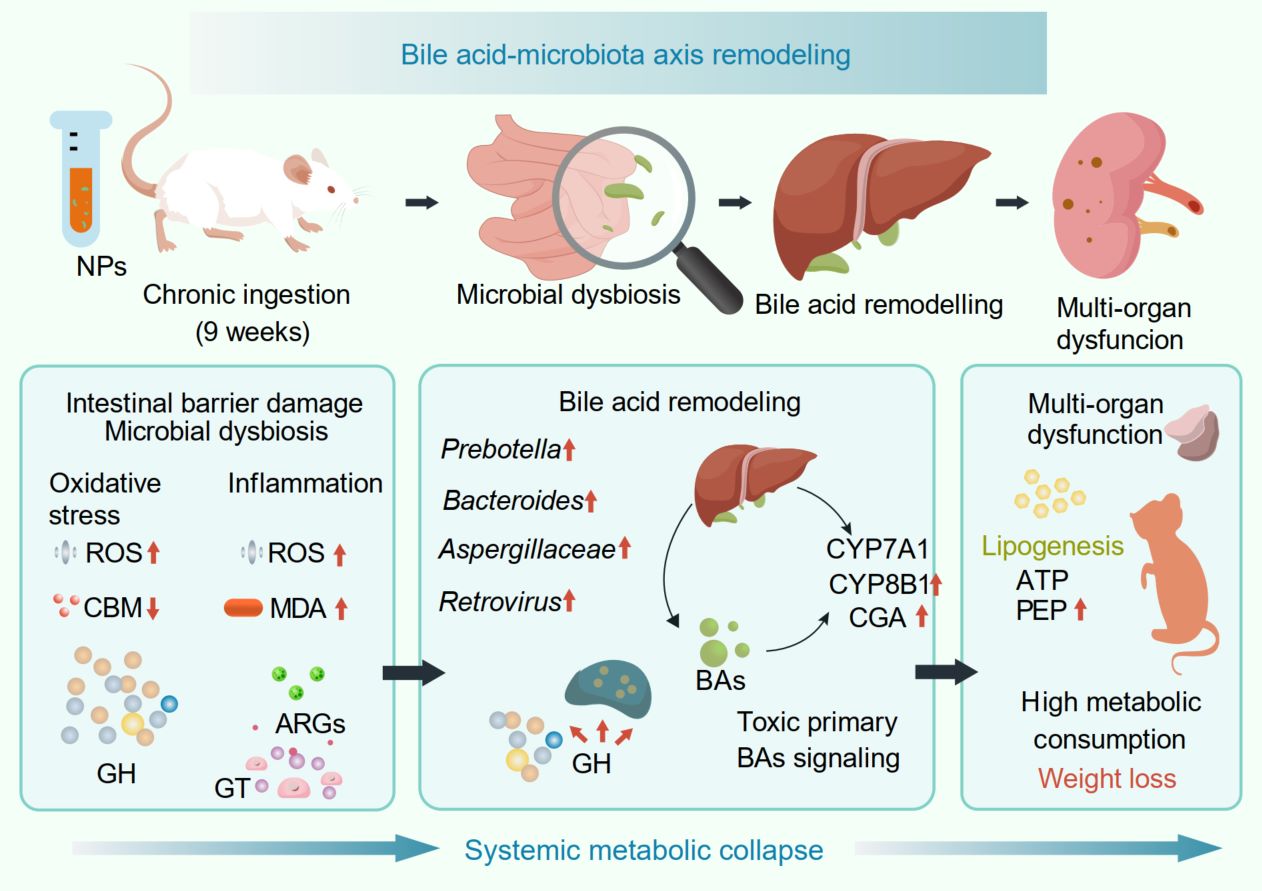
The pervasiveness of microplastic pollution poses a growing health risk, yet its long-term metabolic consequences remain poorly defined. Here, we exposed mice to polyethylene terephthalate nanoparticle (NP) and combined histopathology, biochemistry, metabolomics, and metagenomics to resolve their interactions. NP ingestion induced a severe systemic phenotype characterized by weight loss, organ atrophy, dyslipidemia, and gut barrier collapse. Mechanistically, NPs disrupted bile acid (BA) homeostasis by hyperactivating hepatic synthesis pathways while suppressing microbial 7α-dehydroxylation. This accumulation of cytotoxic BAs drove hepatic lipogenesis and aggravated mucosal inflammation. Crucially, metagenomics uncovered significant gut microbiota dysbiosis, where the enrichment of bile salt hydrolase-encoding taxa and depletion of 7α-dehydroxylating clades reinforced this BA imbalance. Furthermore, the microbiota exhibited functional deterioration, shifting toward glycan degradation with a concurrent loss of antibiotic resistance genes, signaling reduced ecological resilience. These findings identify BA dysregulation and specific microbiota functional losses as primary drivers of NP-induced systemic metabolic collapse.
CAT-BLAST: Engineered bacteria for robust targeting and elimination of cancer-associated fibroblasts
- 05 January 2026
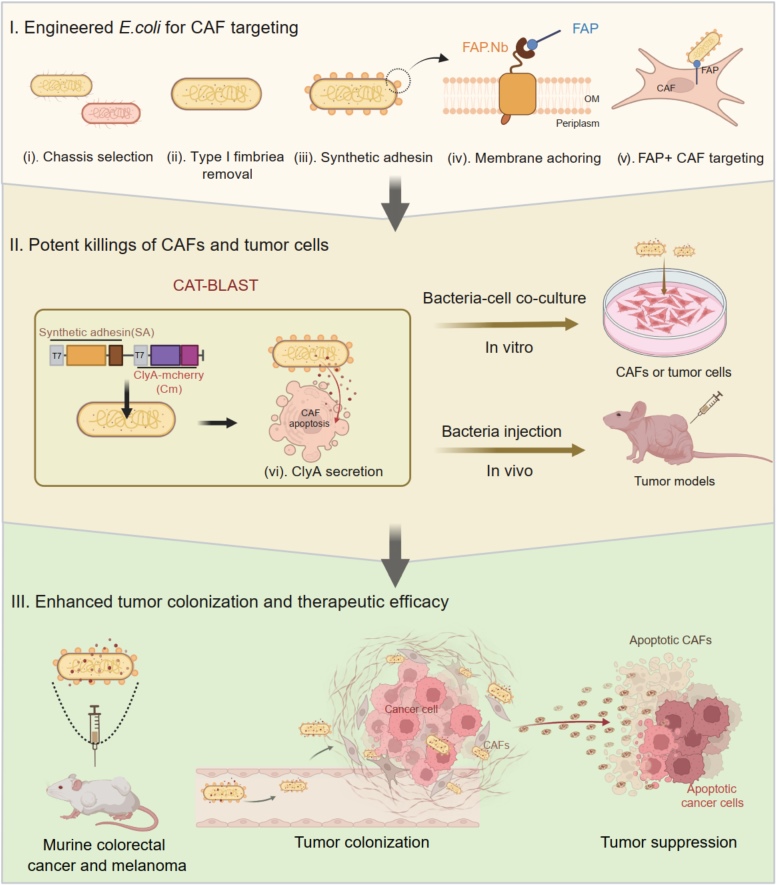
Cancer-associated fibroblasts (CAFs) construct a protective stromal barrier that promotes tumor growth and resistance to therapy. To dismantle this, we developed CAT-BLAST, an engineered bacterial platform designed to potently eliminate these cells. We engineered a safe, high-expression E. coli chassis, arming it with a FAP-specific synthetic adhesin for precise CAF targeting and the ability to secrete the ClyA cytotoxin to induce apoptosis in both CAFs and adjacent tumor cells. This platform demonstrated robust, FAP-specific targeting across diverse human tumor xenograft models and achieved significant tumor suppression in both murine colorectal cancer and melanoma.
fastp 1.0: An ultra-fast all-round tool for FASTQ data quality control and preprocessing
- 09 September 2025
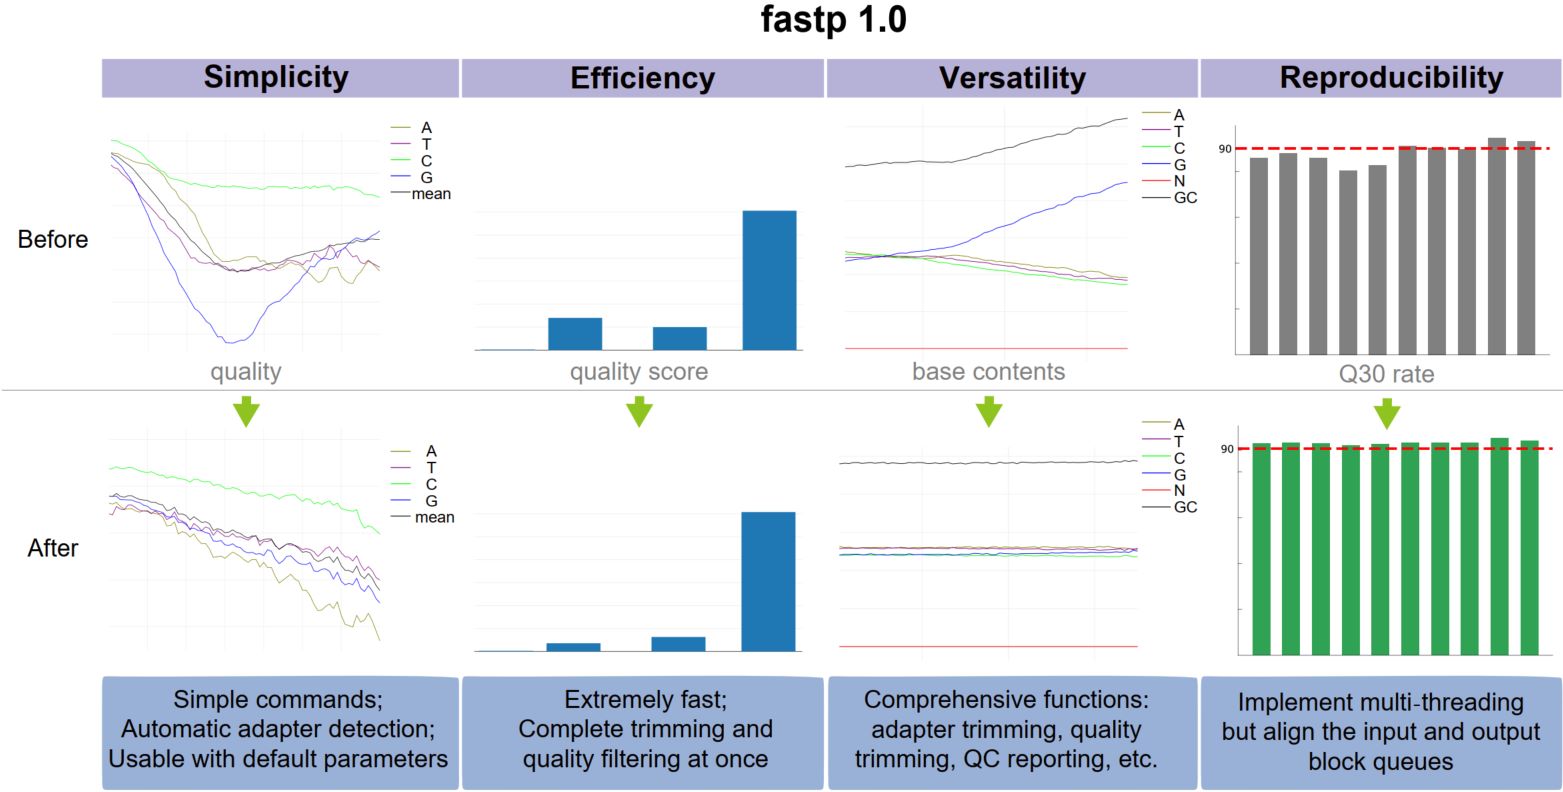
The figure shows side-by-side quality comparison of the data before and after preprocessing using fastp 1.0. As can be seen from this figure, the data quality has been significantly improved after fastp processing. The Q20 ratio and Q30 ratio increased, and the GC base ratio returned to balance.
EasyMetagenome: A user-friendly and flexible pipeline for shotgun metagenomic analysis in microbiome research
- 14 February 2025
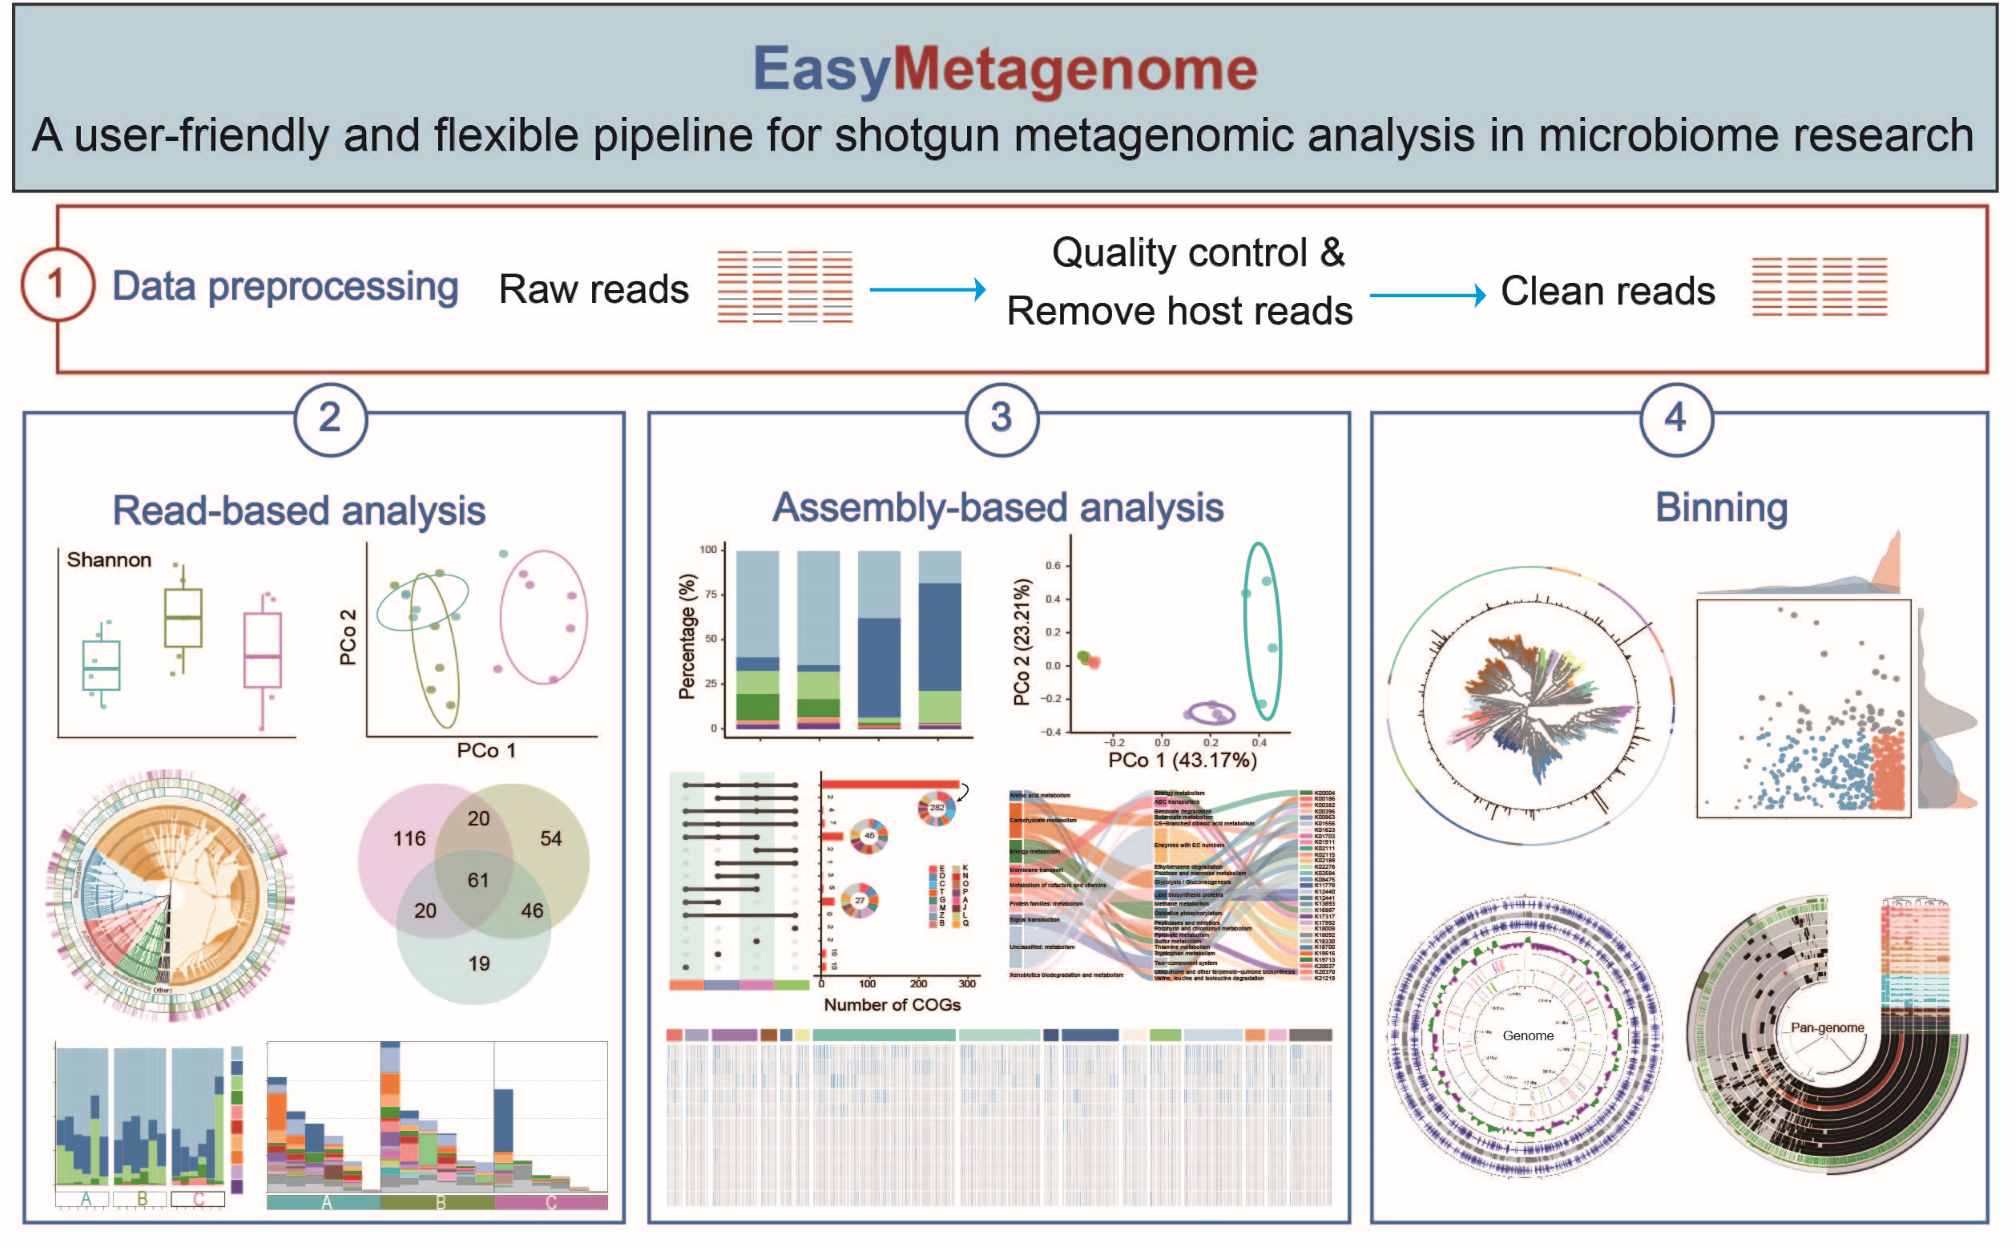
EasyMetagenome is a user-friendly shotgun metagenomics pipeline designed for comprehensive microbiome analysis, supporting quality control, host removal, read-based, assembly-based, binning, genome and pan-genome analysis. It offers customizable settings, data visualizations, and parameter explanations. The pipeline is freely available at https://github.com/YongxinLiu/EasyMetagenome.
Gut–X axis
- 26 February 2025
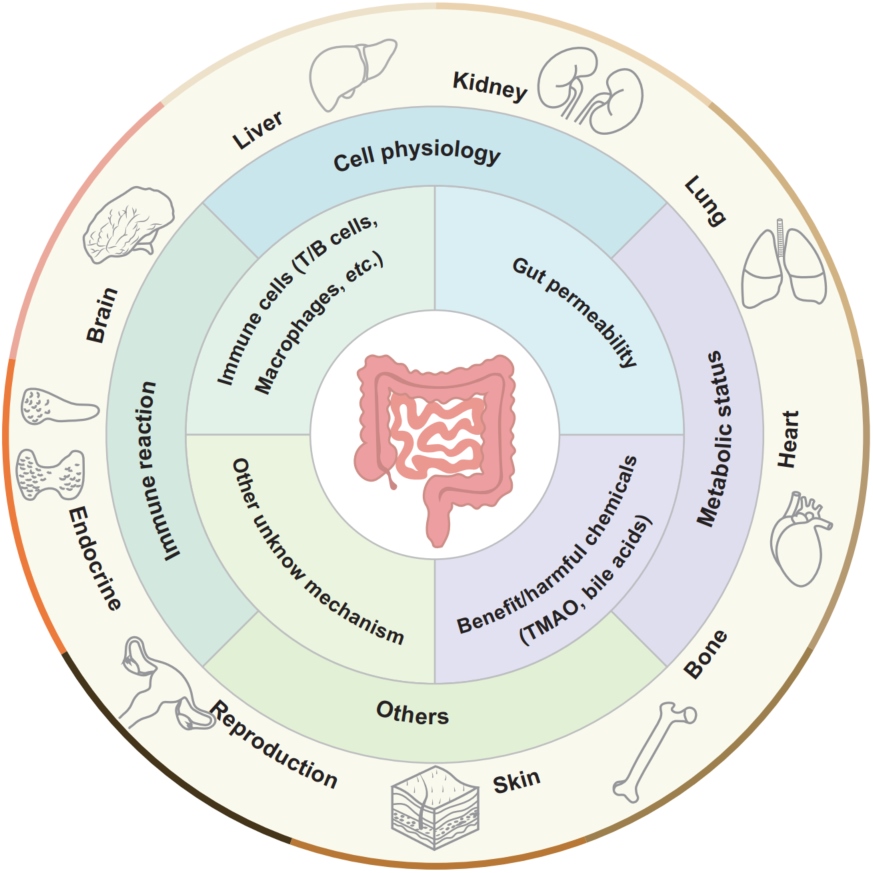
The concept of “gut–X axis”: the intestine and intestinal microbiota are proven to be able to modulate the pathophysiologic progressions of the extraintestinal organs' diseases. The bioactive chemicals and/or intestinal immune cells can translocate into the circulatory system and other organs and influence the immune reactions, metabolic status, cells physiology, and so forth of extraintestinal organs, finally regulating these organs' homeostasis. Meanwhile, other organs may reversely impact the intestine, namely such regulatory axis is bidirectional.
Ultrafast one-pass FASTQ data preprocessing, quality control, and deduplication using fastp
- 08 May 2023
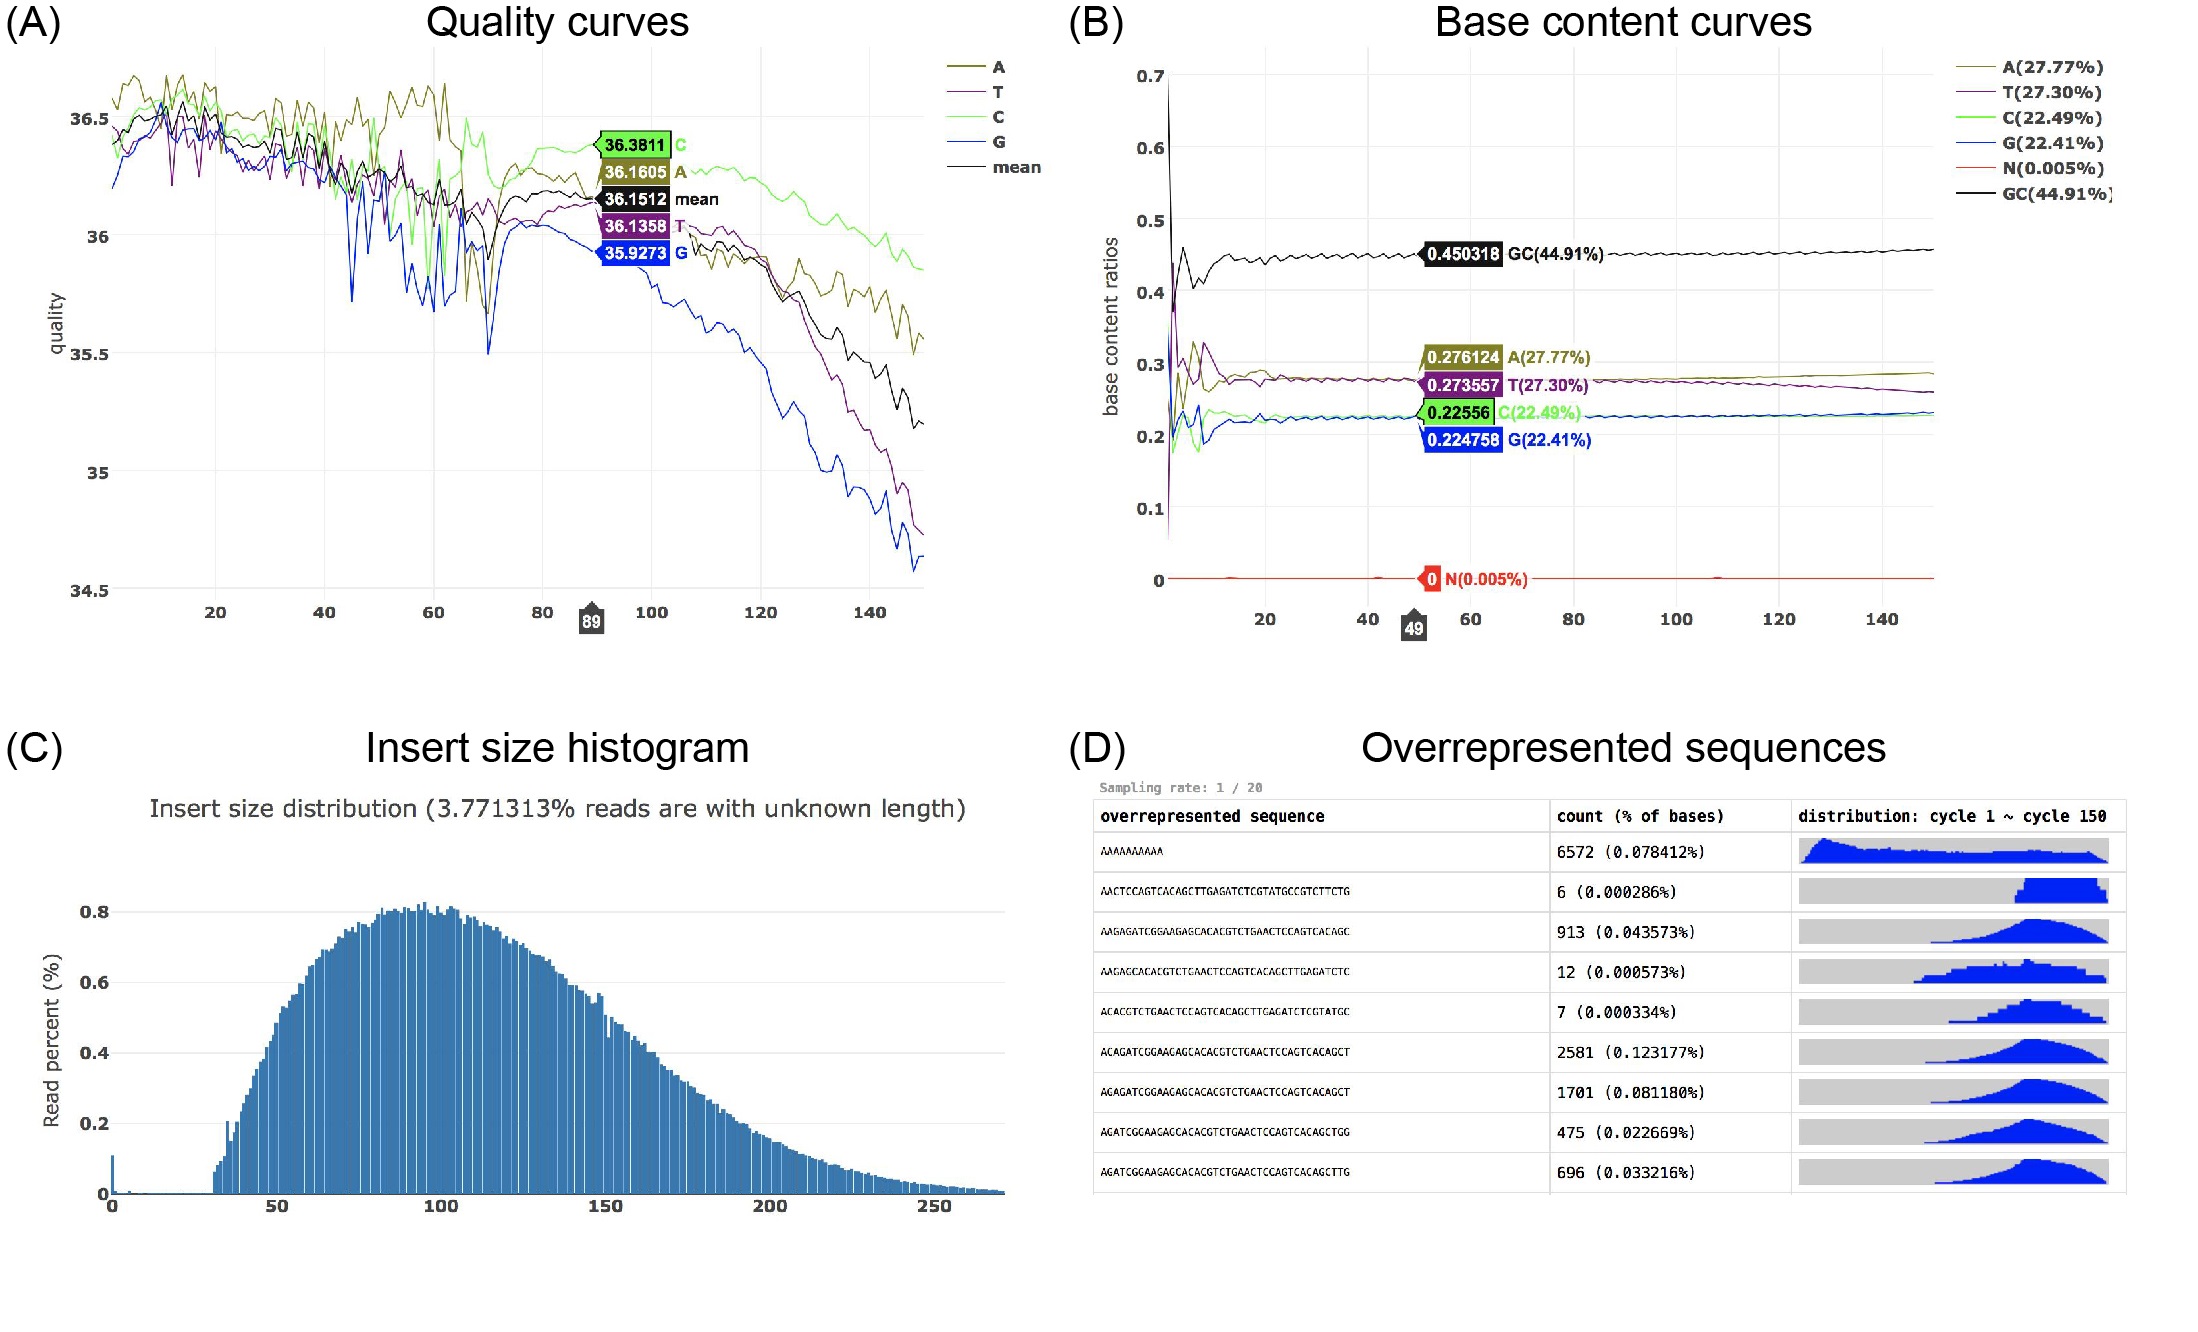
Fastp is a widely adopted tool for FASTQ data preprocessing and quality control. It is ultrafast and versatile and can perform adapter removal, global or quality trimming, read filtering, unique molecular identifier processing, base correction, and many other actions within a single pass of data scanning. Fastp has been reconstructed and upgraded with some new features. Compared to fastp 0.20.0, the new fastp 0.23.2 is even 80% faster.
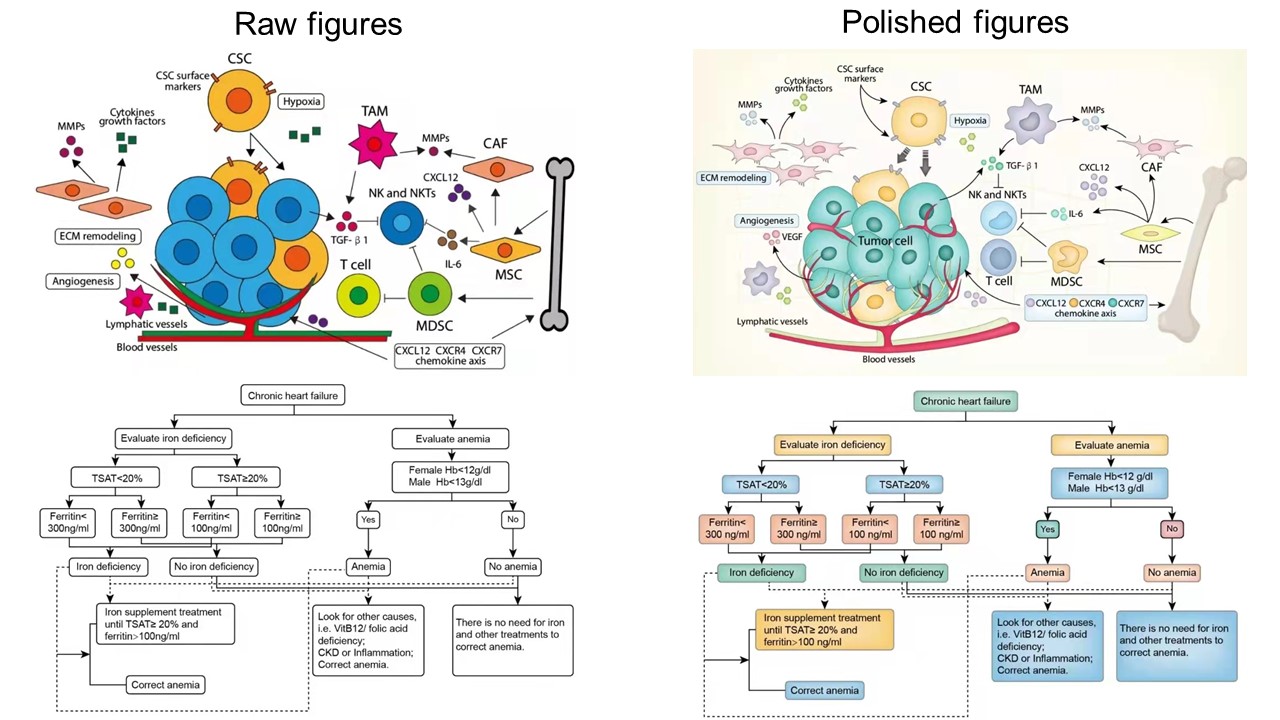
ImageGP: An easy‐to‐use data visualization web server for scientific researchers
- 21 February 2022
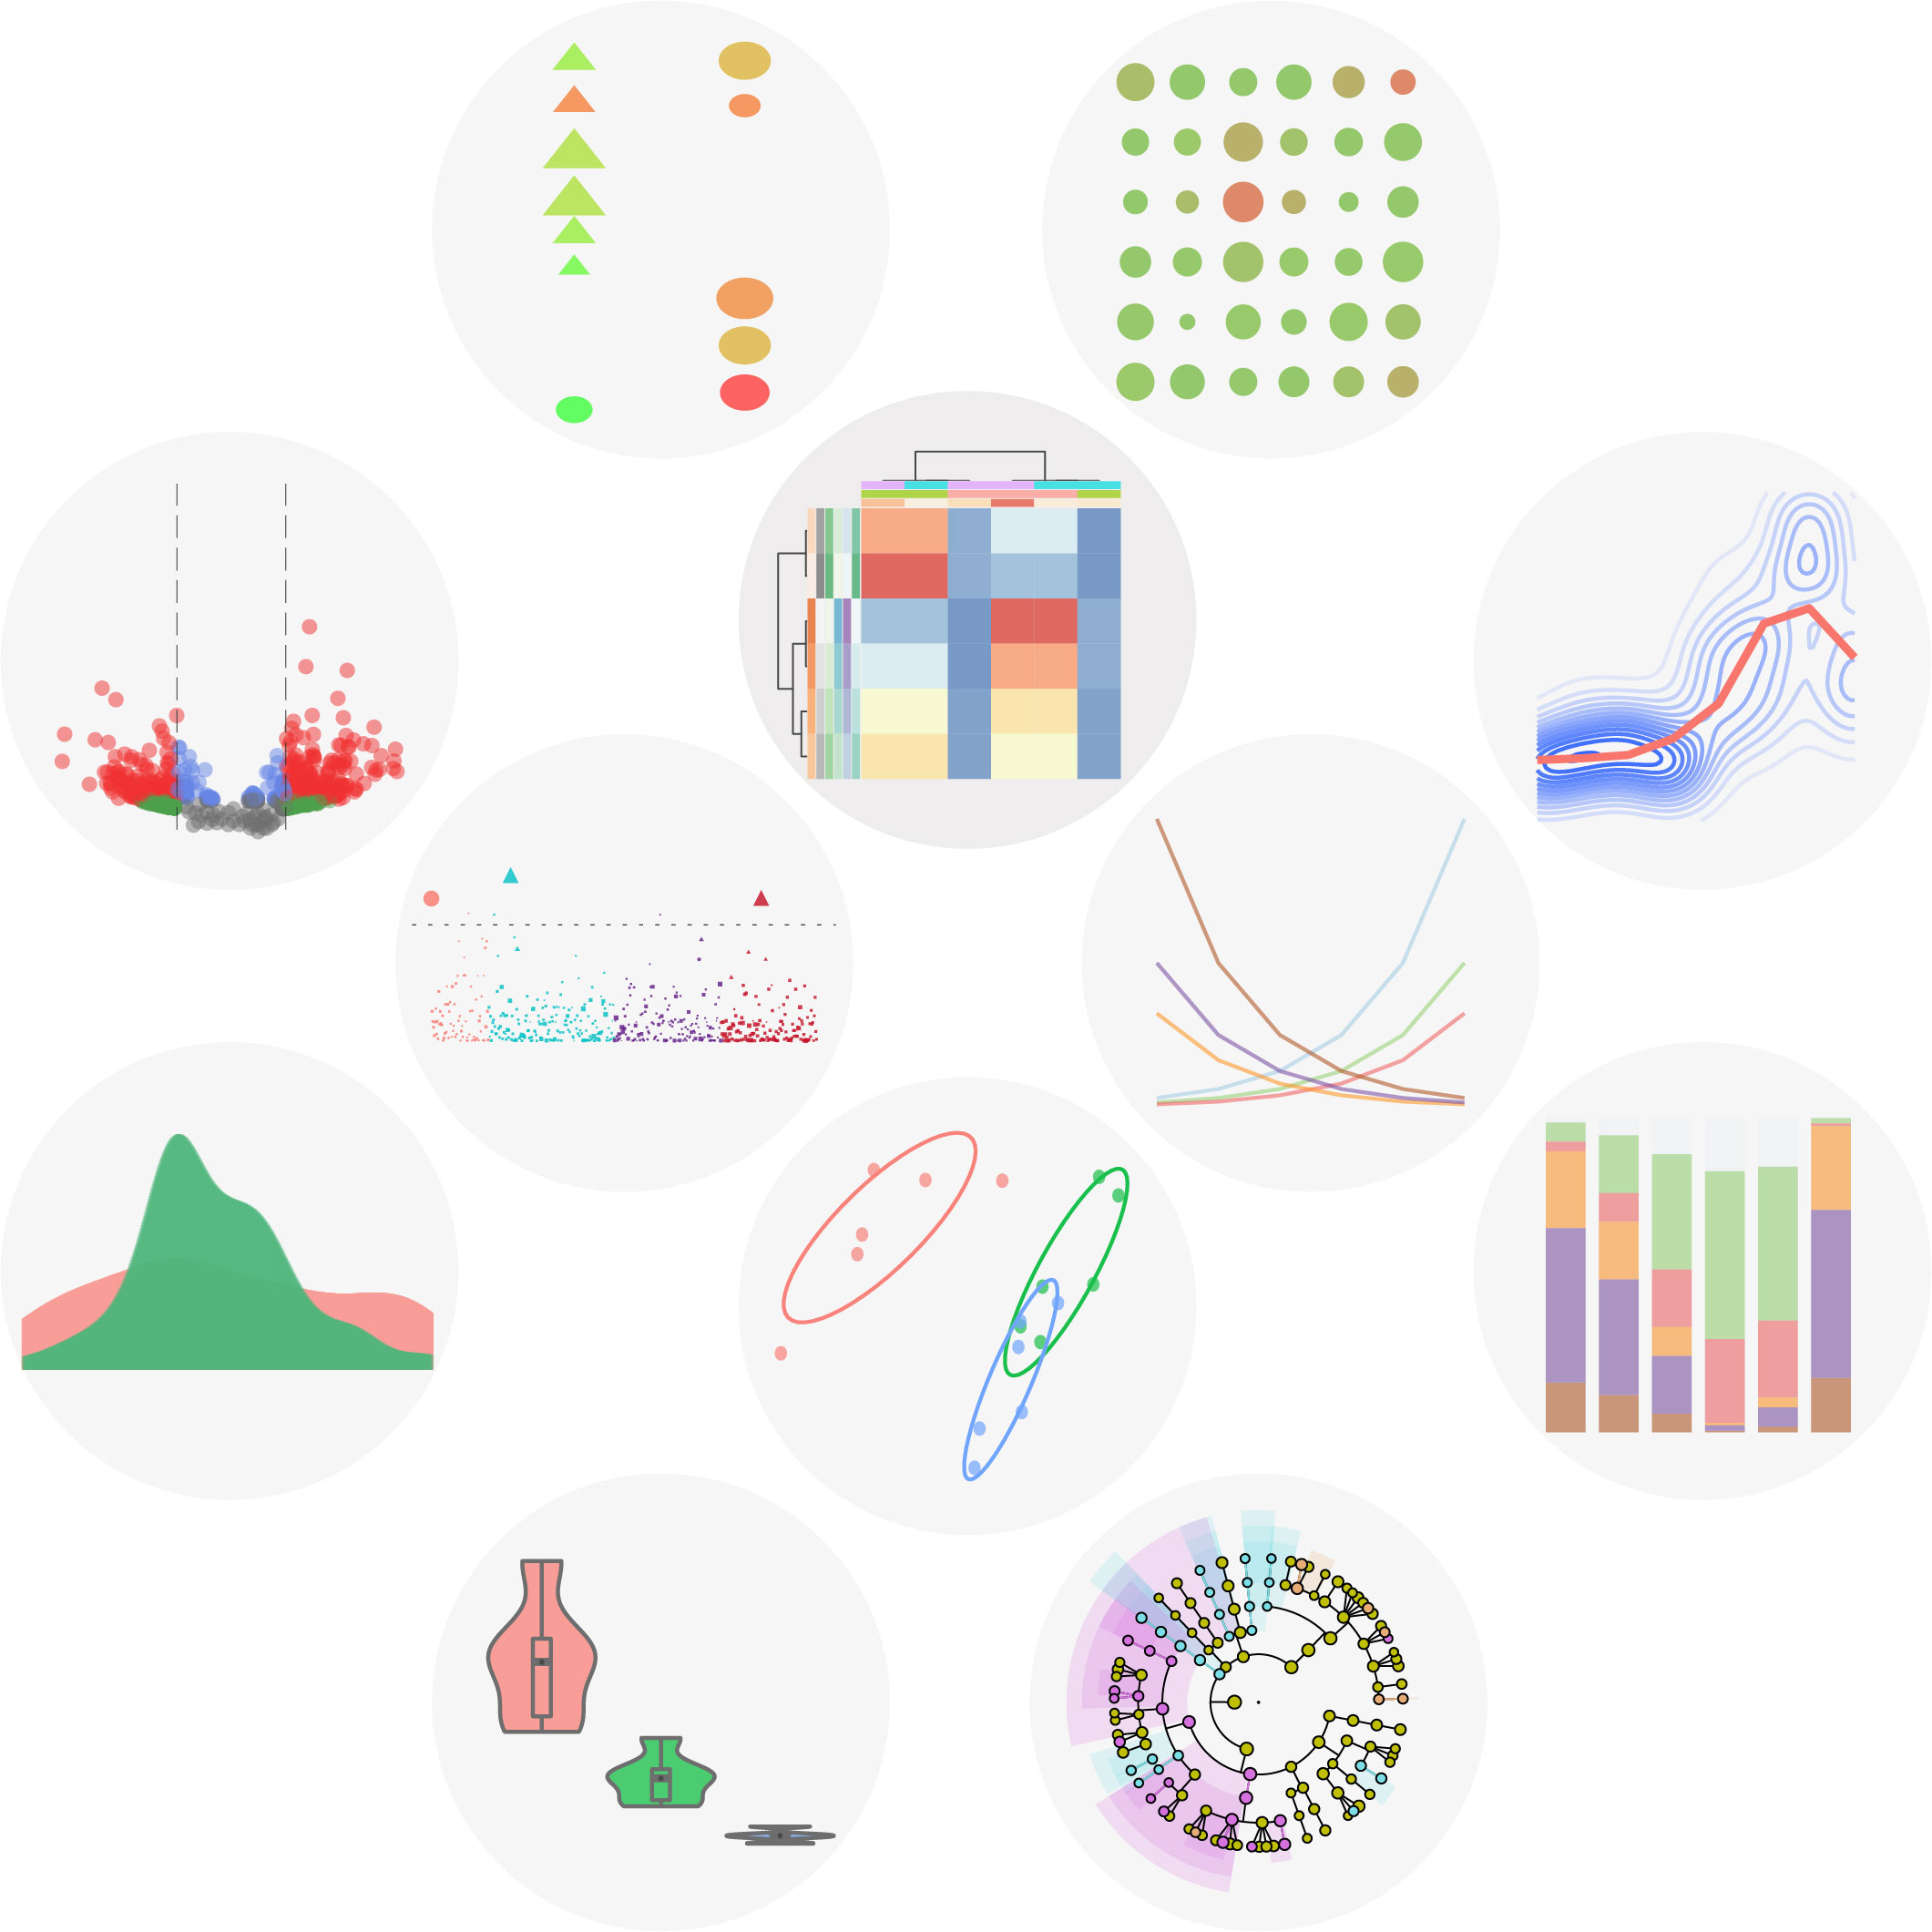
Representative visualization results of ImageGP. ImageGP supports 16 types of images and four types of online analysis with up to 26 parameters for customization. ImageGP also contains specialized plots like volcano plot, functional enrichment plot for most omics-data analysis, and other 4 specialized functions for microbiome analysis. Since 2017, ImageGP has been running for nearly 5 years and serving 336,951 visits from all over the world. Together, ImageGP (http://www.ehbio.com/ImageGP/) is an effective and efficient tool for experimental researchers to comprehensively visualize and interpret data generated from wet-lab and dry-lab.
Ggtree: A serialized data object for visualization of a phylogenetic tree and annotation data
- 28 September 2022
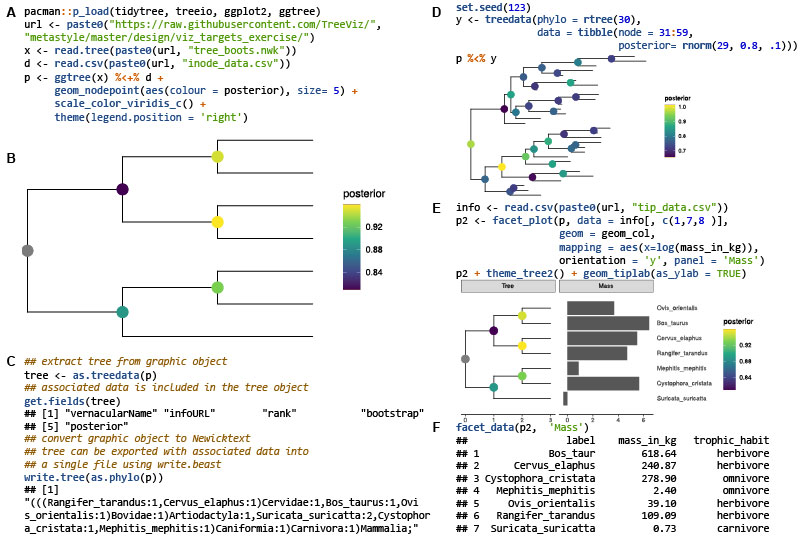
The ggtree object is designed to store phylogenetic tree and associated data, and the object itself is a graphic object that can be rendered as an image file. This work will increase the reproducibility and reusability of phylogenetic data, as well as facilitate integrative and comparative studies.
Using PhyloSuite for molecular phylogeny and tree-based analyses
- 16 February 2023
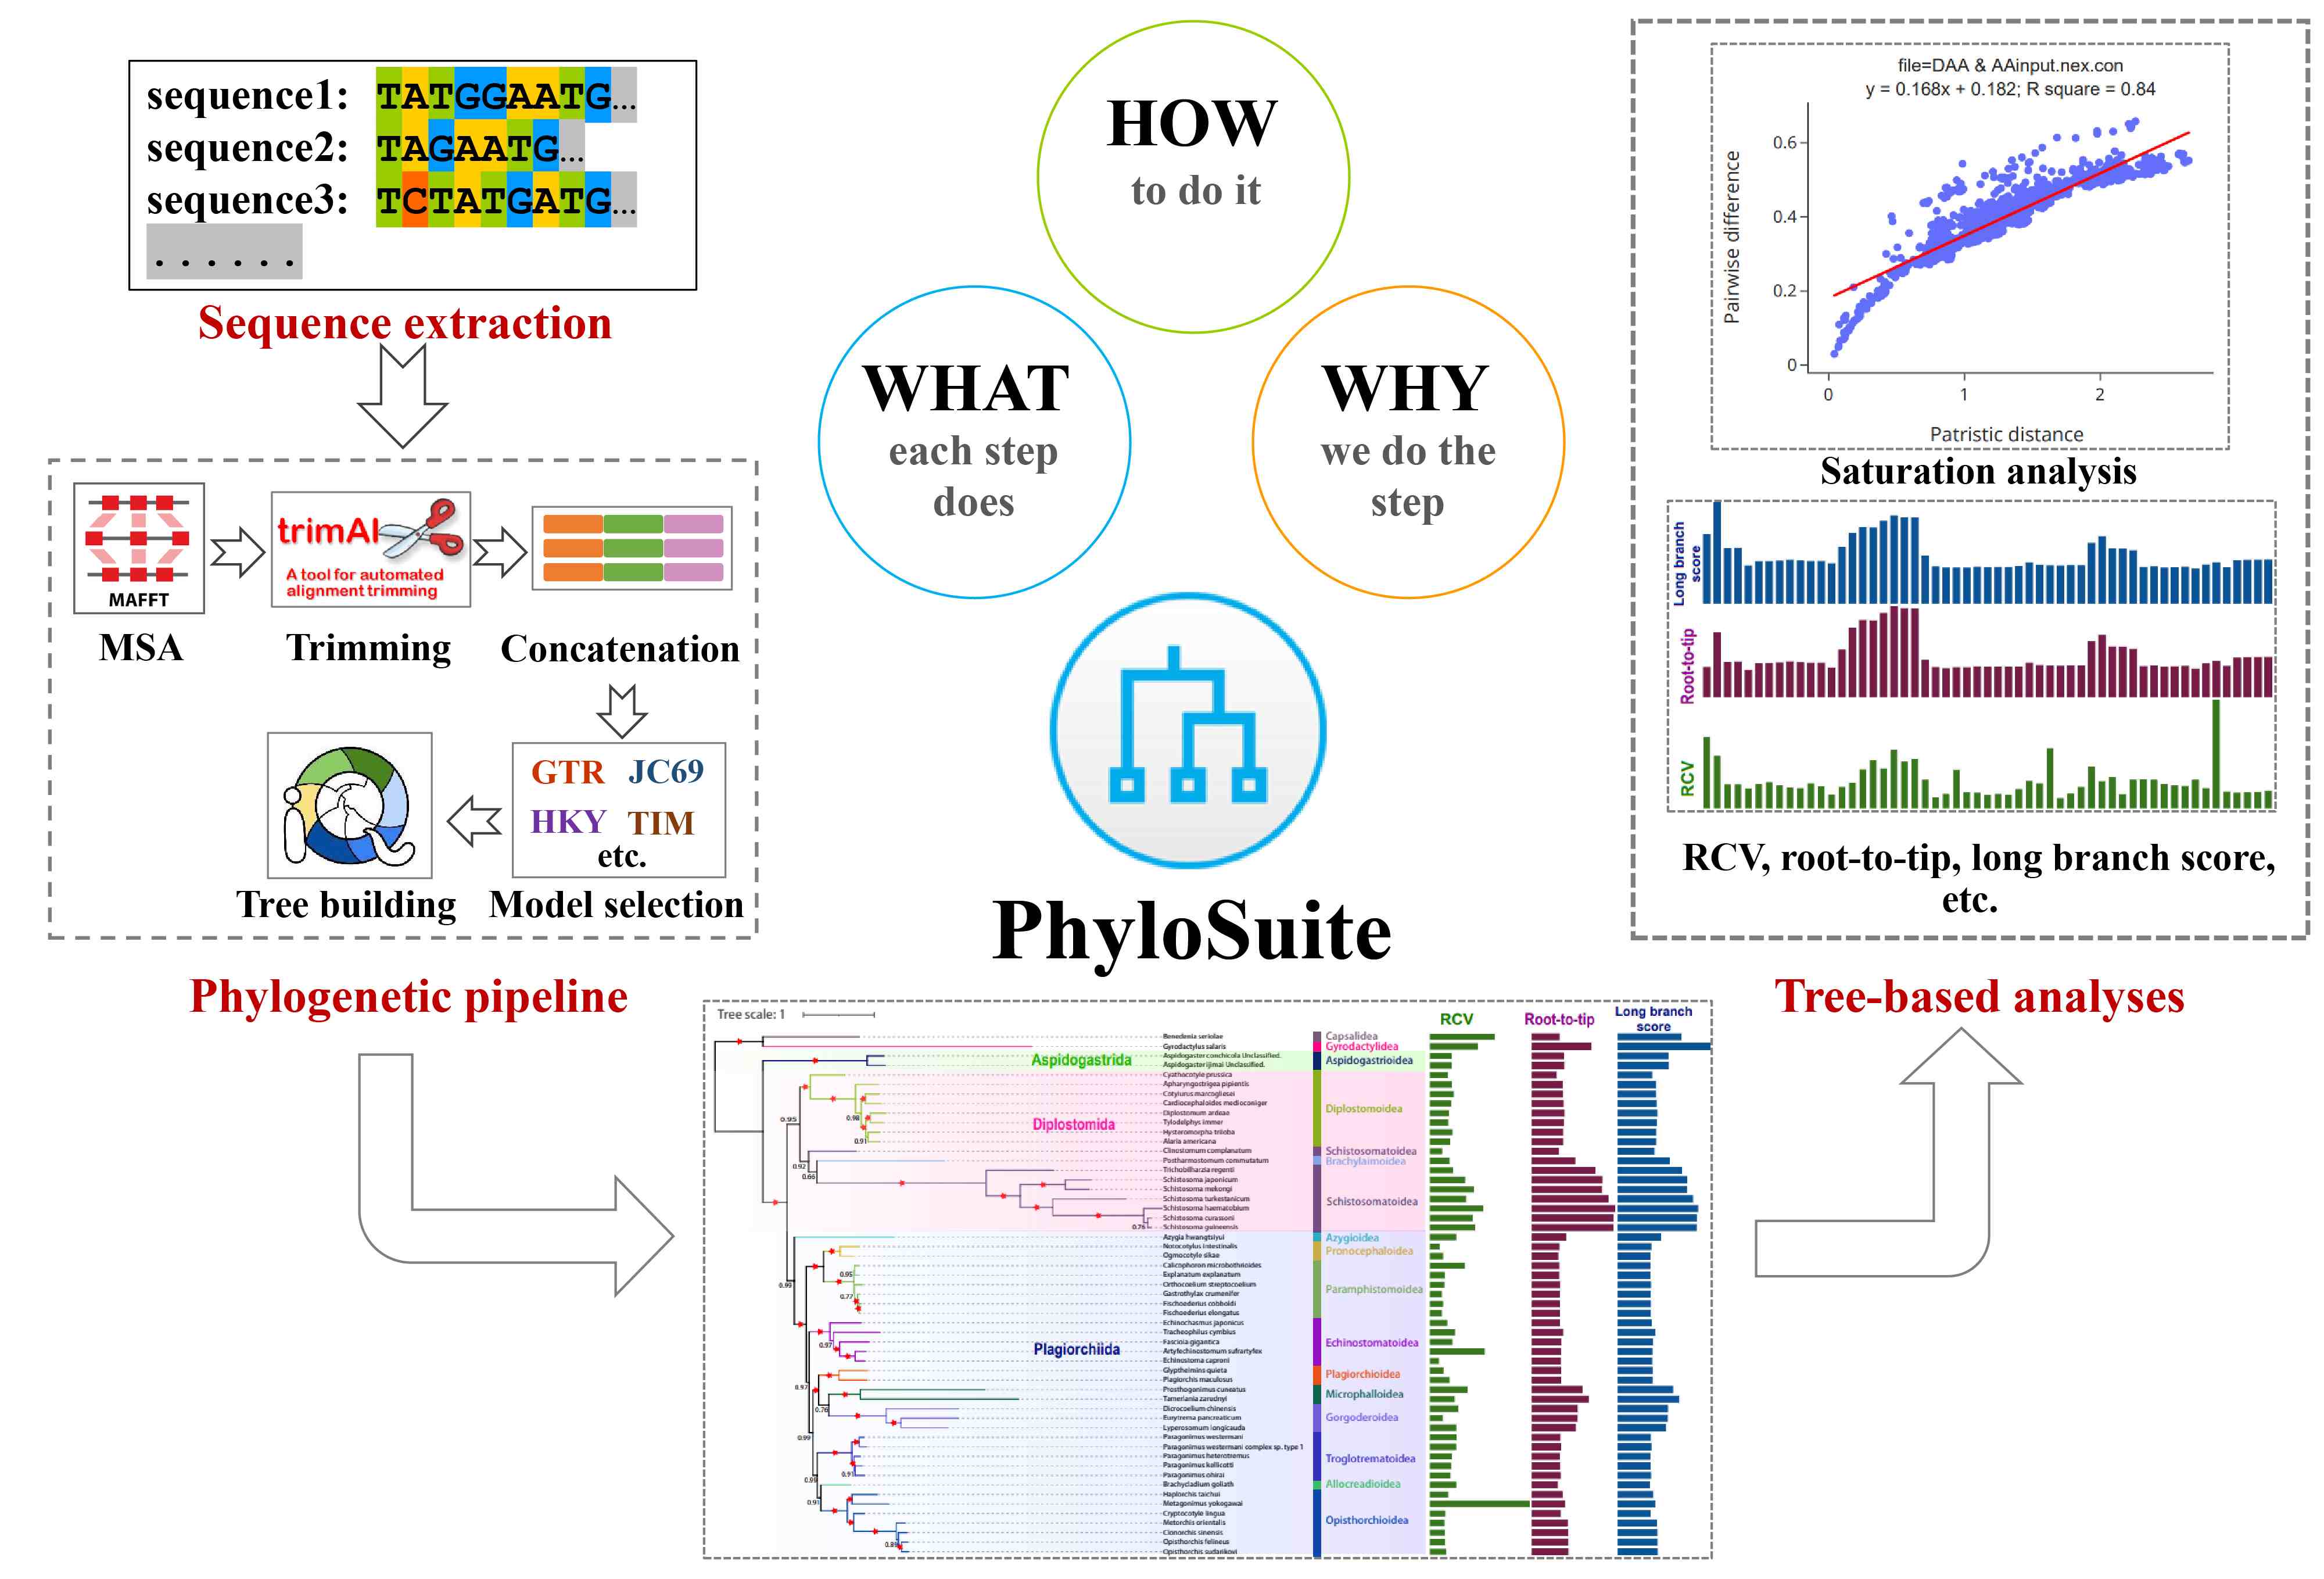
A new release of PhyloSuite, capable of conducting tree-based analyses. Detailed guidelines for each step of phylogenetic and tree-based analyses, following the “What? Why? and How?” structure. This protocol will help beginners learn how to conduct multilocus phylogenetic analyses and help experienced scientists improve their efficiency.